Deer Learning
Problem
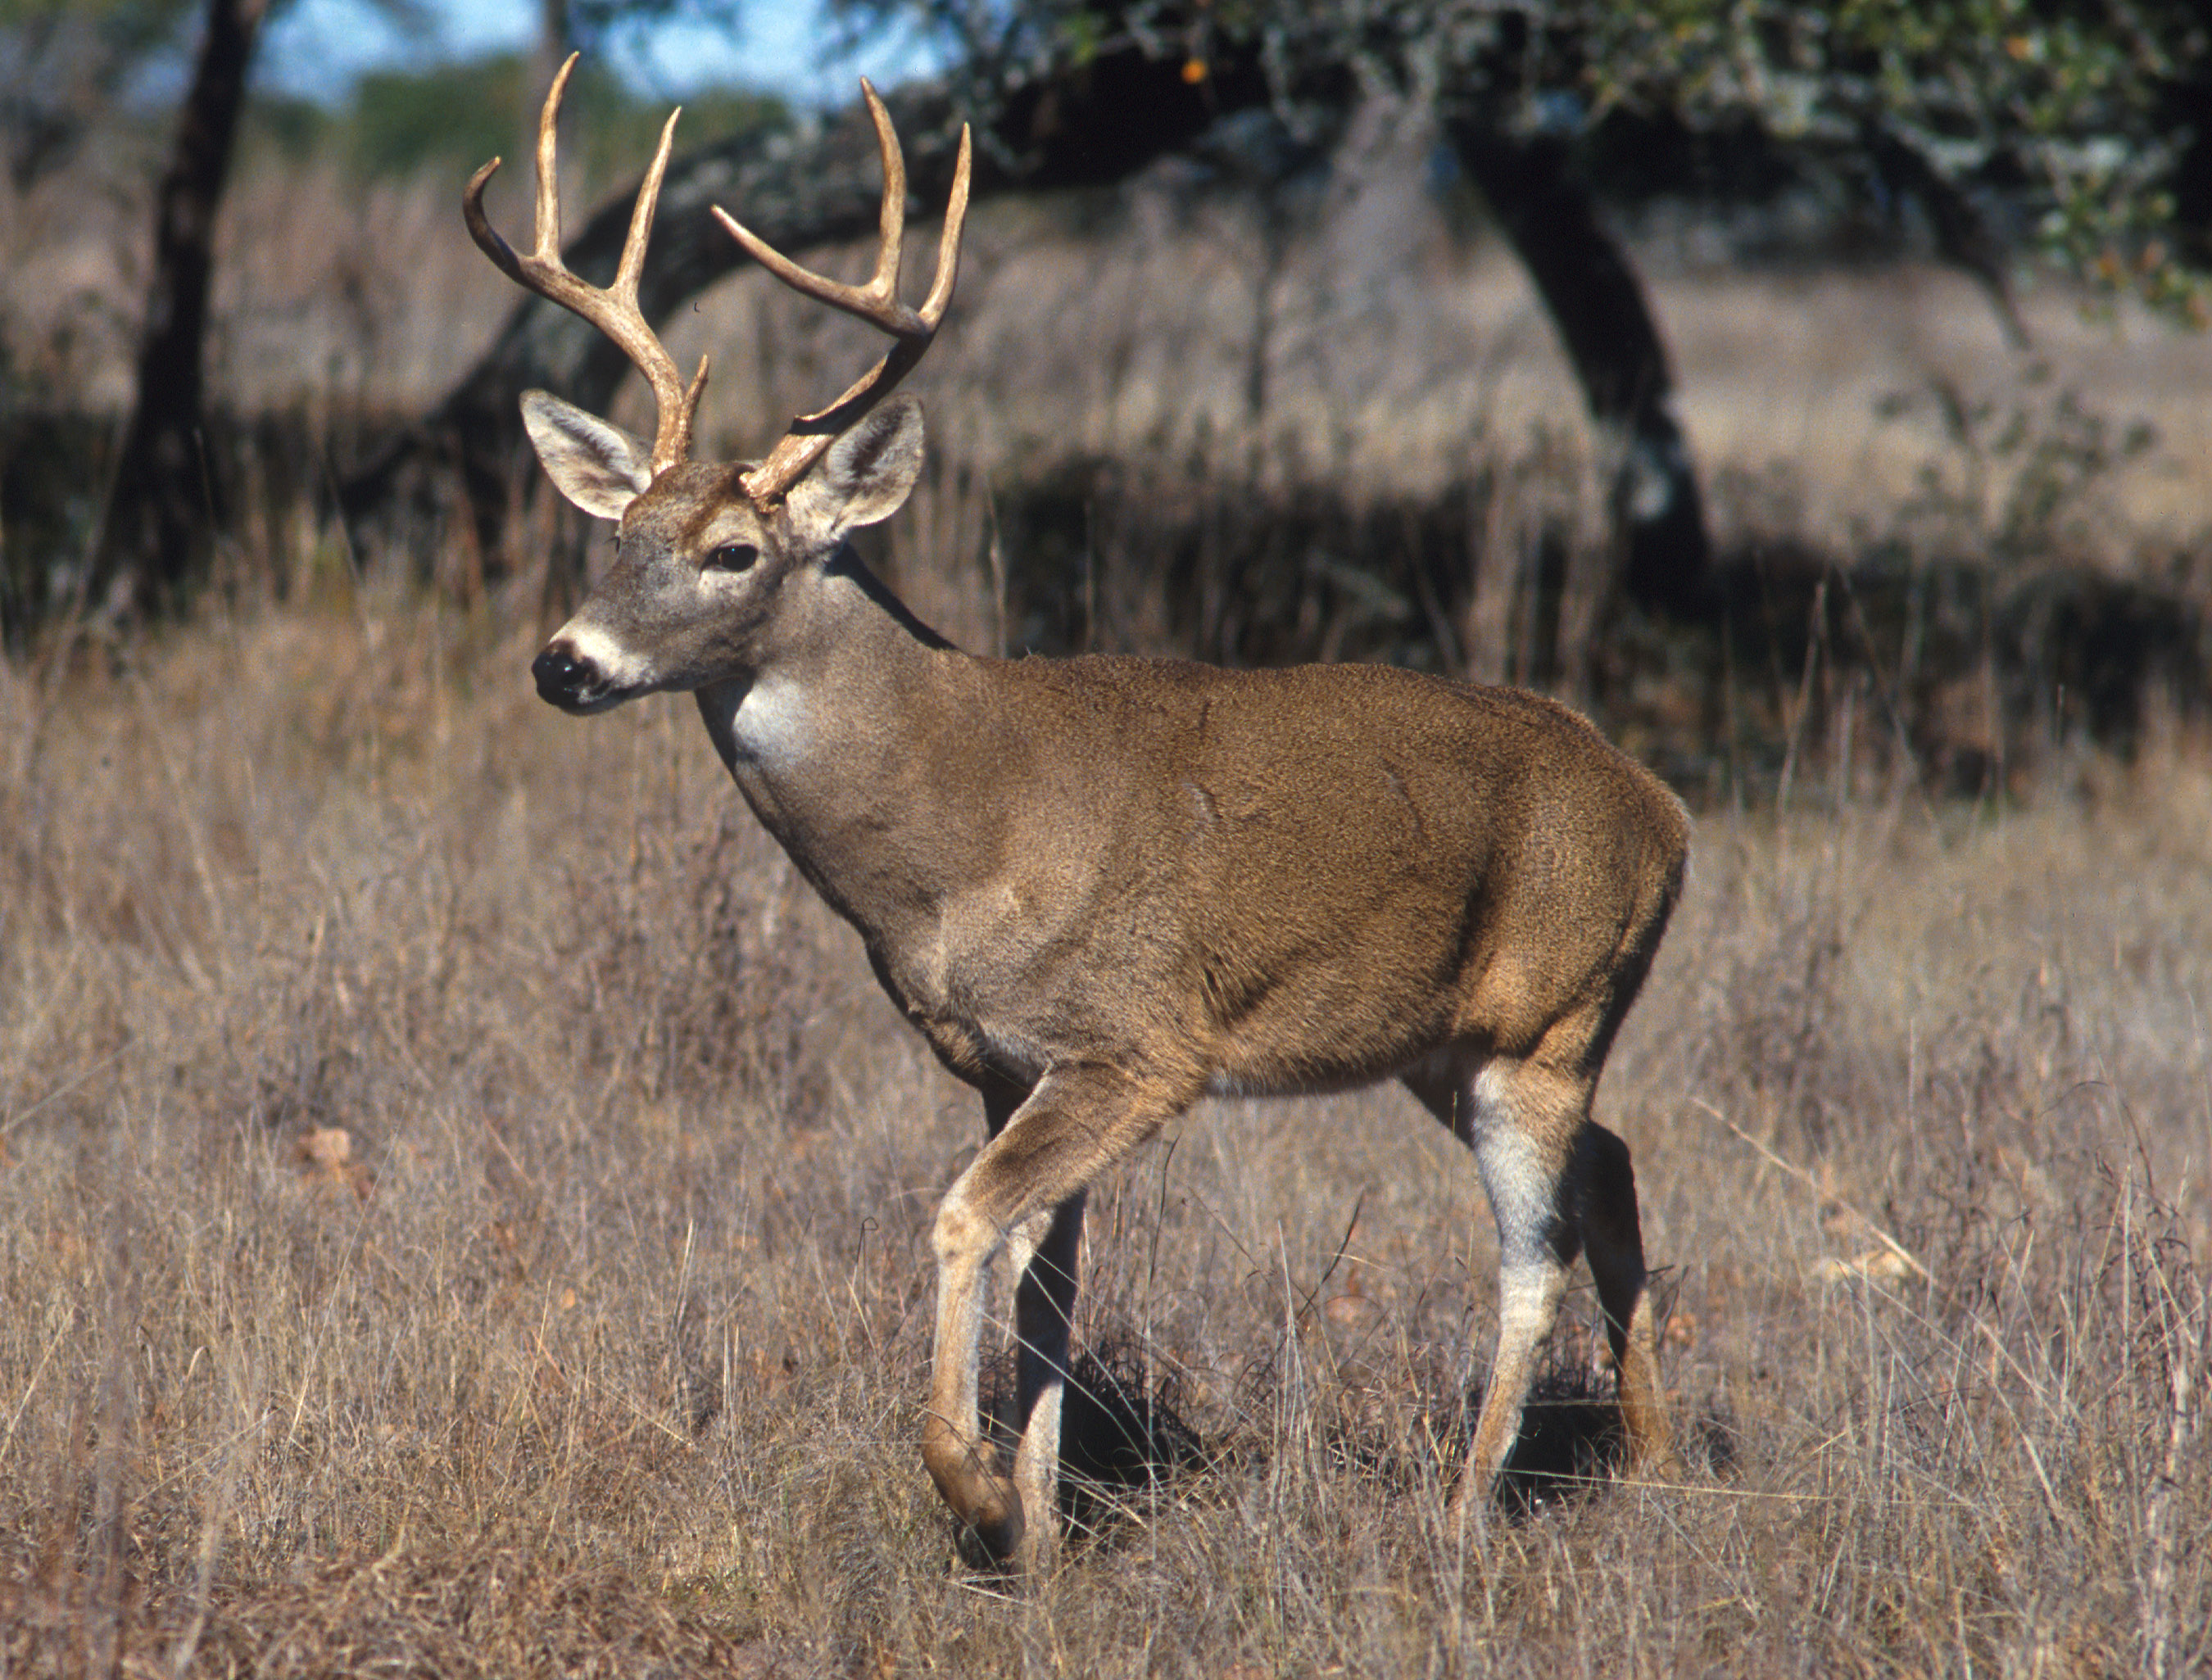
One of the most important key indicators for a hunting ranch is the health of the deer on their property. Ranch owners will often set up cameras around their ranch to capture videos of animal movement. These images are then painstakingly classified by hand. The more male deer there are on the ranch, the more desirable the location to hunters.
For our project in our machine learning class, we wanted to solve this problem. We knew someone that was able to provide pictures of deer and other animals from several cameras from his property. We were given thousands of pictures to work with, so we got right to work.
Our Process
The different types of animals we were provided were: turkeys, pigs, racoons, and white tail deer. While the primary goal is to track male white tail deer, data on other classifications would be valuable to ranches. We got started by building upon a previous machine learning project that was built on FastAI. FastAI is a wrapper around PyTorch that simplifies training models. We were quickly able to insert the data provided and get a model with 99.3% accuracy, but we knew that this was unrealistically high, and something must have been wrong. So unlike many other machine learning projects, our goal was to get the accuracy down by preventing overfitting.
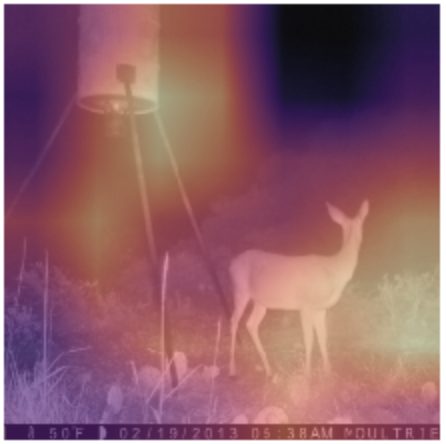
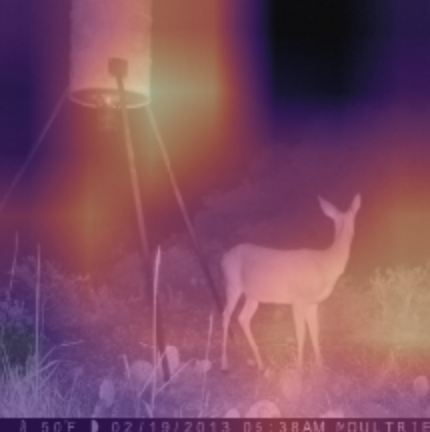
After looking closer at the data, we came to the realization that the images were all too similar and it was using the wrong features of the images to make the classification. We implemented heatmaps to see what the model thought was important, and you can see just how poorly it was performing.
It was clear that our data needed to be cleaned, so we did a few things to improve it. First, our data had a lot of duplicate images due to the fact that they were from video streams. We scrubbed the images of duplicates. While doing this, we also split the data into test and training sets. We were careful to get as much variety in the training set as possible, and mixed in some challenging images in the test set. This brought the accuracy down to 86%. Given the amount of images that we had and the quality of those images, this sounded more along the lines of what we would expect.
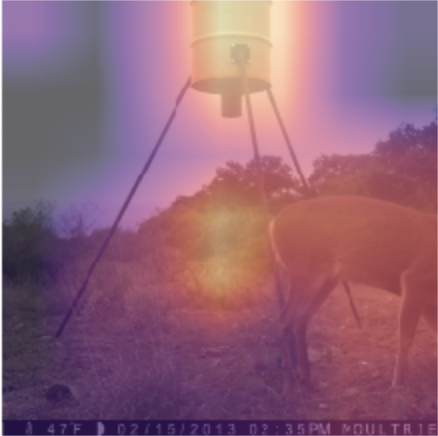
Our data set had one big problem. While we had lots of pictures with animals, we had no pictures that were empty. This, in combination with the duplicates is what causing such bad attention. Before we checked the attention, we acquired and inserted these images. After inserting these images, the accuracy increased to 88.5%, and the attention improved significantly as seen below.
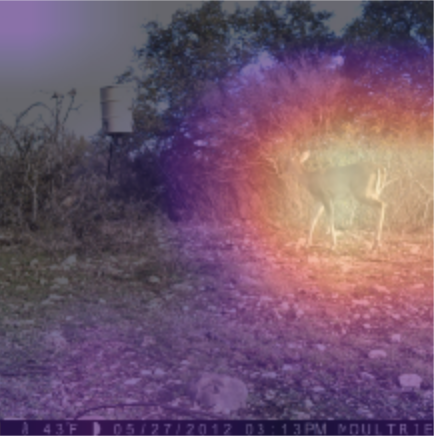
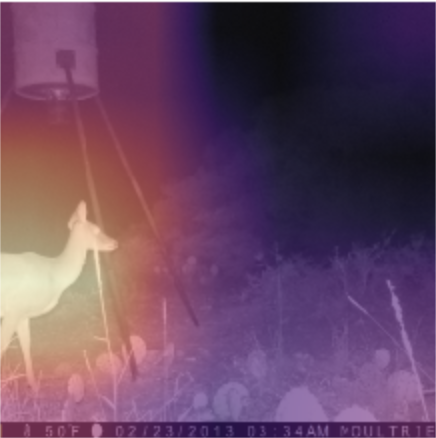
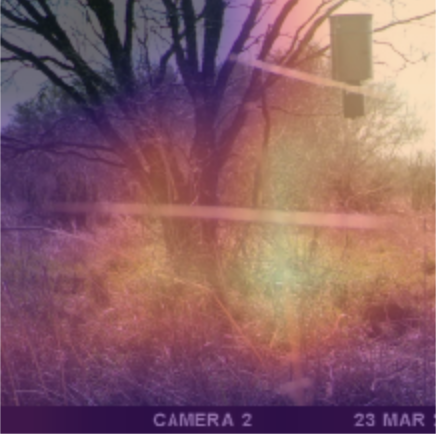
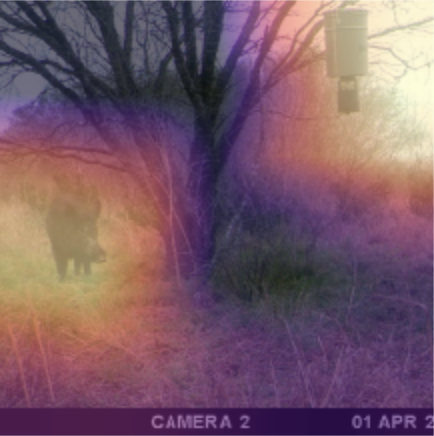
The attention is by no means perfect, but it is behaving the way we would expect. In the above pictures, you can see that the model generally uses the area around the deer to classify. The image that is interesting here is the empty picture. Almost the entire image is highlighted, suggesting that it couldn’t find anything.
Up to this point, we had just been cleaning the data that we were given. We updated the model a bit and we found that changing from resnet34 to restnet50 improved the accuracy to 91.5%. We felt pretty confident in the model at this point, but we knew that the dataset could improve.
We built a web scraper to pull images from Google. We collected 80 images of each classification. After including these images, the accuracy jumped all the way to 96%. We also output the model file itself for this to be utilized in a production environment.
Below is our final confusion matrix.
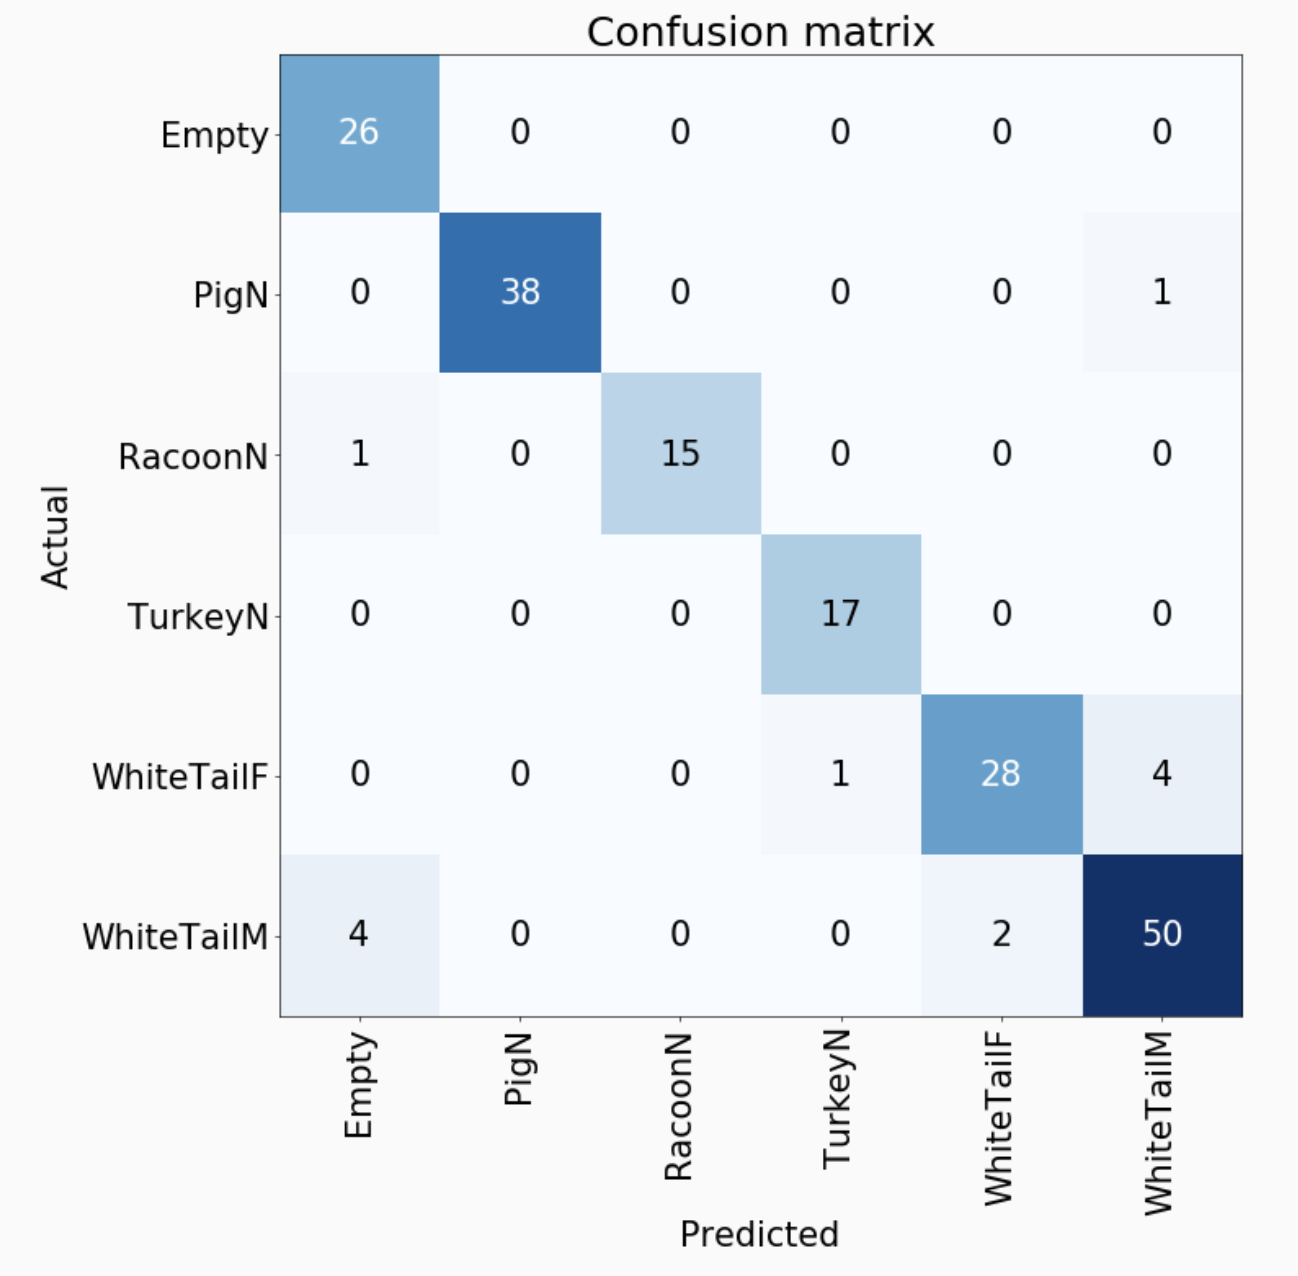
The results are exactly what we would expect. It occasionally misses thinking that an image is empty when it actually has deer or a racoon in it. This mostly has to do with the fact that we intentionally put difficult-to-classify images in the dataset. These images do not have a complete animal in the picture; usually just the head of a deer. Other images have a deer far in the distance. It also has some misses when trying to differentiate male and female deer, but is still able to do surprisingly well at 93% accuracy. This is actually a suprisingly difficult task considering the fact that male deer shed their antlers in the winter.
Data Analysis
At this point, we were satisfied with the model performance and thought that perhaps we could glean some insights from the data. The best way to visualize this data we felt was to map it. Now in this case, we did not have the latitude/longitude of the cameras, so we inserted our own data that was reasonable. We were still able to pull a lot of great data from the image metadata, including the date it was taken and the camera ID. Using this data, we were able to simulate what the animal activity looked like around the different cameras.
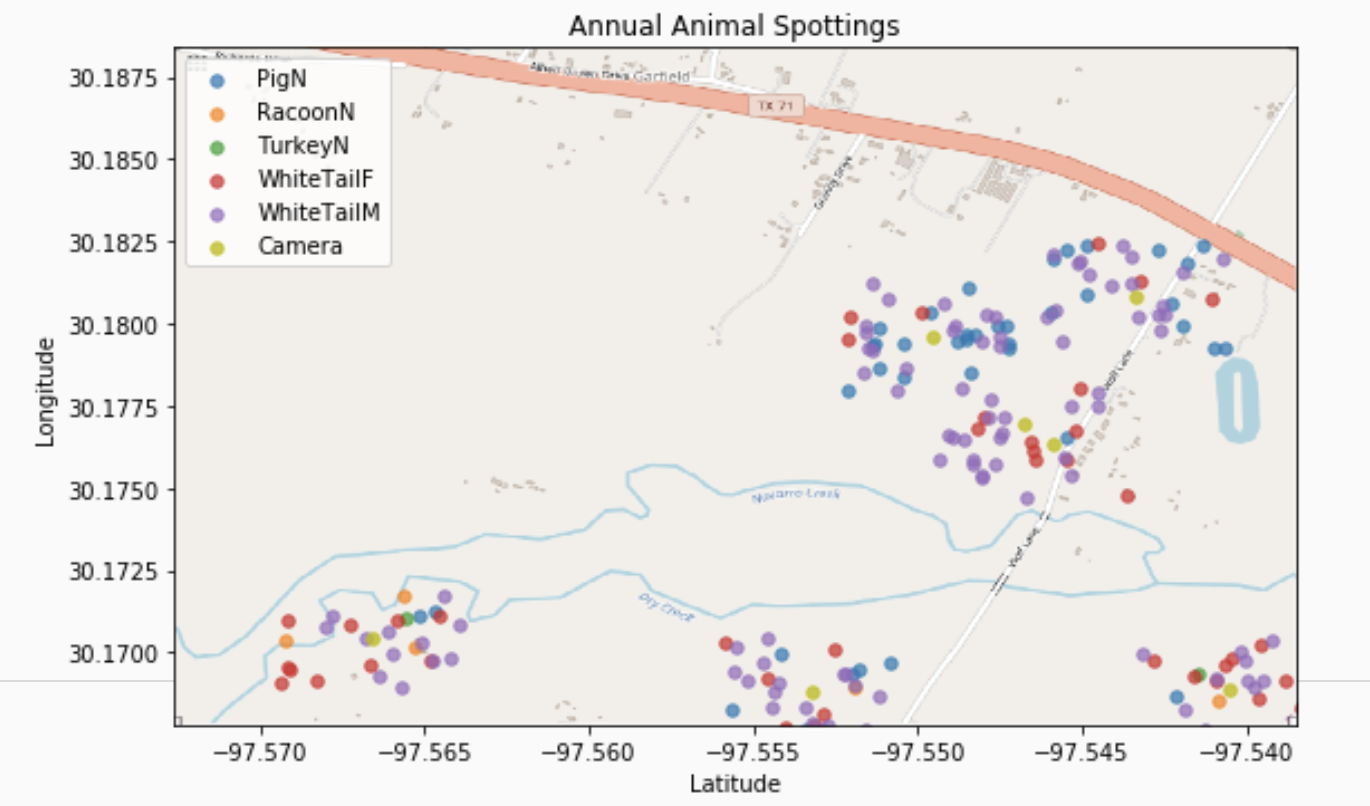
Nothing too insightful from mapping the annual data. So what if we map it out by months?
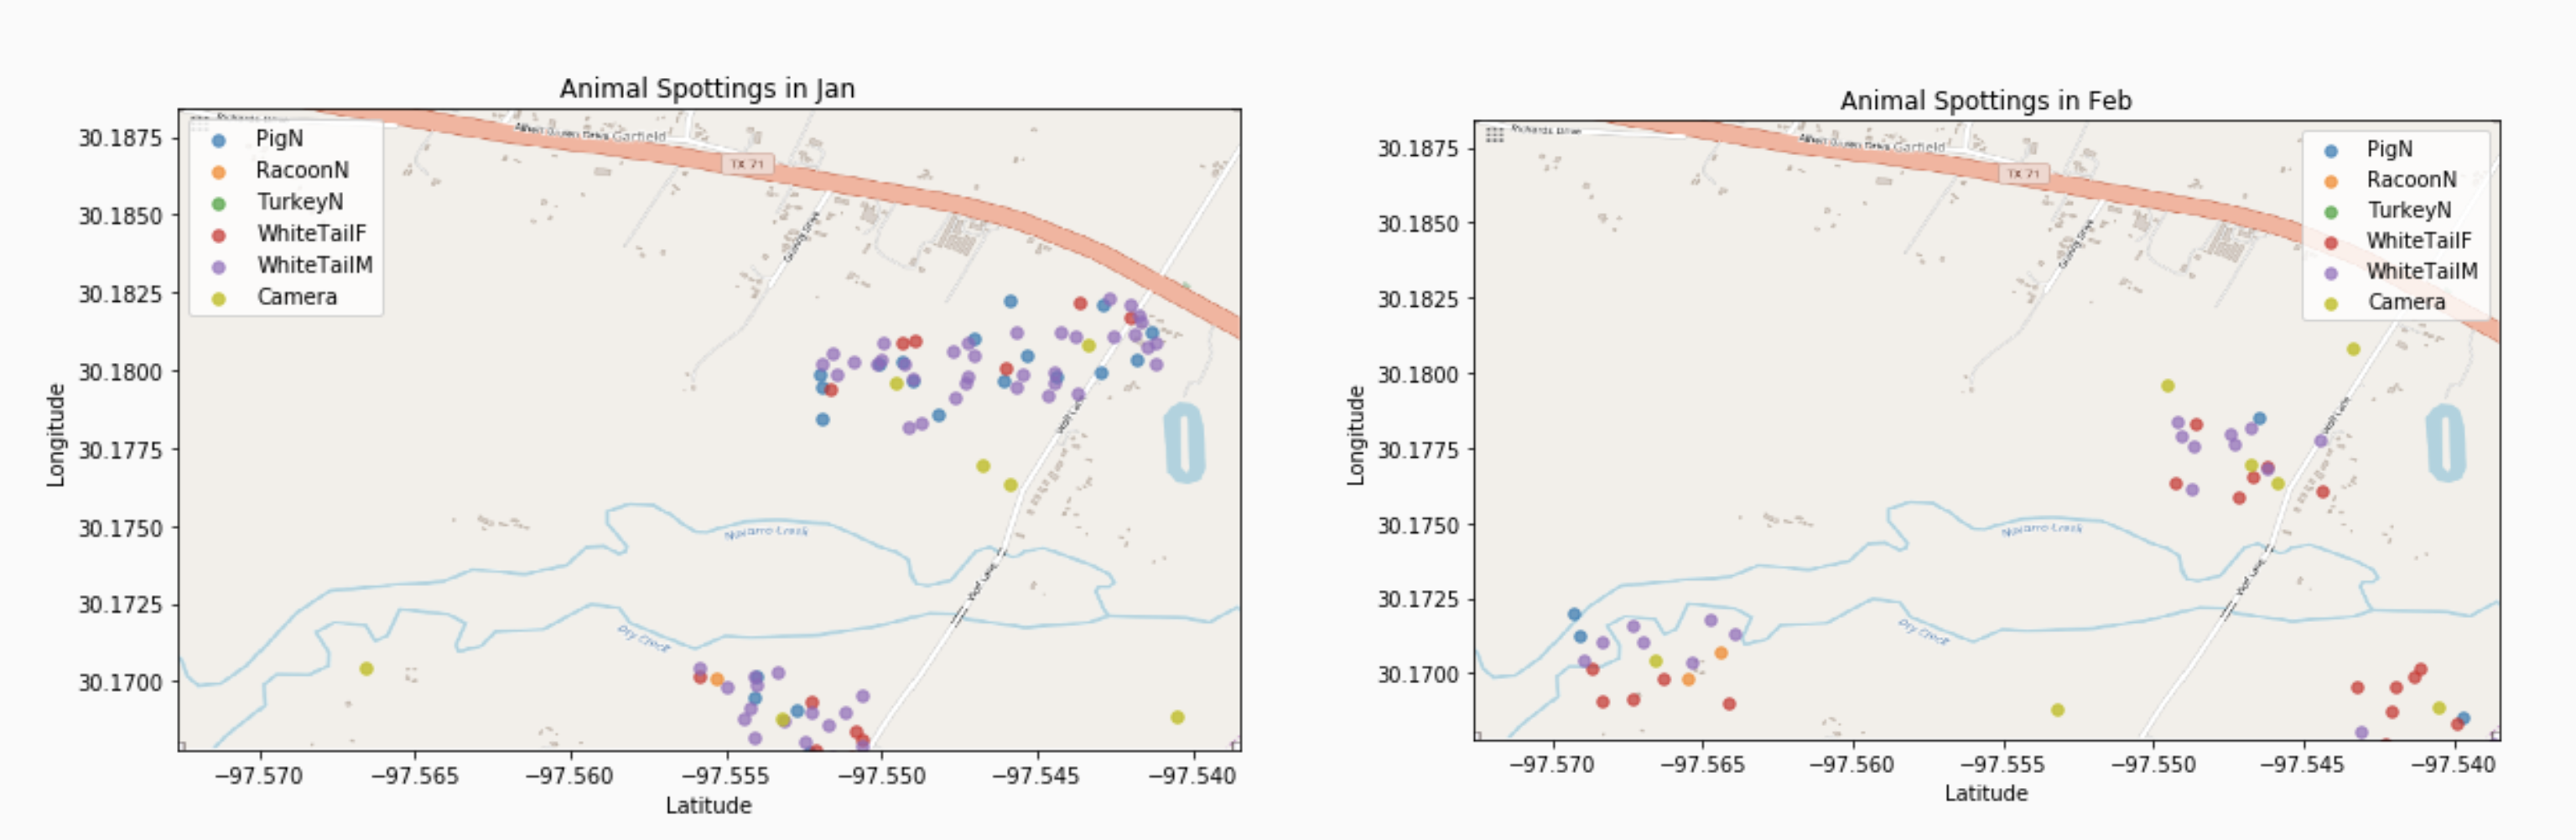
Well, not much there either. What we did find however is that while the data we were given was enough to train the classifier, there is not enough data to glean any good insights. If we were to get more data, we could come to much better conclusions about the ranch. This model could be particularly powerful if used across multiple ranches, as then broader conclusions can be made about overall animal population and migration patterns.
Lessons Learned
- If you are working with a small dataset, it is critical to have empty images so that it does not use background features to classify.
- Try to augment the dataset with new data if possible.
- Analyze the performance of your model using heatmaps or saliency maps.
- Do not use images that are too similar.
Future Plans
We wanted to introduce non-image data into the model. Date, time, and latitude/longitude would be extremely useful data in classification. This will certainly be a future task.
As this is intended to use data from live cameras, and animals move in unpredictable ways, a few things could be done to decrease the amount of error. First of all, if you were to classify every single picture that came from a camera, you would end up with a larger animal count than you would expect. Having a certain time limit before you count a new image would be critical to prevent this. Additionally, the animal could be off in the distance where the model is not great at classification. Getting the confidence score of each classification and determining an acceptable threshold would be very useful to cut down on the amount of errors.